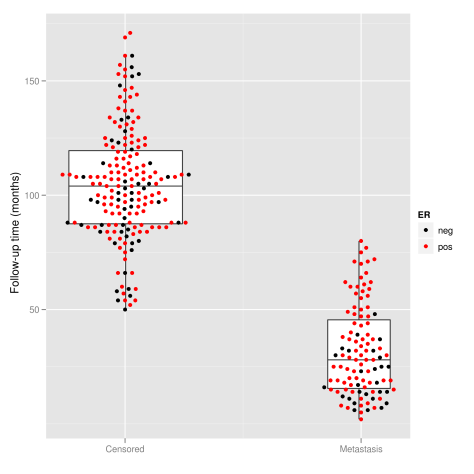
A colleague showed me results of his study project with beeswarm plots made by GraphPad. I was wondering if it could be implemented in R and more specifically with ggplot2.
There is a R package allowing to draw such graphs, the beeswarm package (beeswarm, cran). An implementation was shown on R-statistics blog but not with ggplot.
First here’s the example from the beeswarm package:
library(beeswarm)
data(breast)
breast2 <- breast[order(breast$event_survival, breast$ER),]

beeswarm(time_survival ~ event_survival, data = breast2, pch = 16,
         pwcol = as.numeric(ER), xlab = '',
         ylab = 'Follow-up time (months)',
         labels = c('Censored', 'Metastasis'))
legend('topright', legend = levels(breast$ER), title = 'ER',
       pch = 16, col = 1:2)

Or even like in Tal Galili’s blog, with a boxplot:
beeswarm(time_survival ~ event_survival, data = breast2, pch = 16,
         pwcol = as.numeric(ER), xlab = '',
         ylab = 'Follow-up time (months)',
         labels = c('Censored', 'Metastasis'))
boxplot(time_survival ~ event_survival, data = breast2, add = T,
        names = c("",""), col="#0000ff22")
legend('topright', legend = levels(breast$ER), title = 'ER',
        pch = 16, col = 1:2)
The trick is to use the beeswarm call to get the x and y position. Beeswarm creates a dataframe from which we can get the necessary positionings.
beeswarm <- beeswarm(time_survival ~ event_survival,
            data = breast, method = 'swarm',
            pwcol = ER)[, c(1, 2, 4, 6)]
colnames(beeswarm) <- c("x", "y", "ER", "event_survival")

library(ggplot2)
library(plyr)
beeswarm.plot <- ggplot(beeswarm, aes(x, y)) +
  xlab("") +
  scale_y_continuous(expression("Follow-up time (months)"))
beeswarm.plot2 <- beeswarm.plot + geom_boxplot(aes(x, y,
  group = round_any(x, 1, round)), outlier.shape = NA)
beeswarm.plot3 <- beeswarm.plot2 + geom_point(aes(colour = ER)) +
  scale_colour_manual(values = c("black", "red")) +
  scale_x_continuous(breaks = c(1:2),
         labels = c("Censored", "Metastasis"), expand = c(0, 0.5))
Do not forget to remove the outliers from your boxplot or they will superimpose with the points created by geom_point.

I wonder if these plots are more useful in certain field. If anybody has references for beeswarm plots, I would be very grateful.

Hi Dennis,
Thank you for the links.
BTW, why won’t you add your site to R-bloggers?
Cheers,
Tal
p.s: it is a good post – thank you for writing it :)
I like it. Except it gets cluttered when beeswarm and boxplot are combined.
The boxplot is not necessary, it is just as an example and can be fine-tuned.
Denis
I was trying to run these codes in R, but I get something strange. Does your code work in updated R?
With R 2.15.2, beeswarm_0.1.5, plyr _1.8 and ggplot2_0.9.3:
beeswarm <- beeswarm(time_survival ~ event_survival,
            data = breast, method = 'swarm',
            pwcol = ER)[, c(1, 2, 4, 6)]
colnames(beeswarm) <- c("x", "y", "ER", "event_survival")

beeswarm.plot <- ggplot(beeswarm, aes(x, y)) +
  xlab("") +
  scale_y_continuous(expression("Follow-up time (months)"))
library(plyr) # to get access to round_any function
beeswarm.plot2 <- beeswarm.plot + geom_boxplot(aes(x, y,
  group = round_any(x, 1, round)), outlier.shape = NA)
### valueS and not value
beeswarm.plot3 <- beeswarm.plot2 + geom_point(aes(colour = ER)) +
  scale_colour_manual(values = c("black", "red")) +
  scale_x_continuous(breaks = c(1:2),
         labels = c("Censored", "Metastasis"), expand = c(0, 0.5))
So call plyr to have access to the function round_any, and use values with an S and not value without S in scale_colour_manual. It should work fine now. If not, please send me your code.
Cheers,
Denis
Hi,
I’m not able to reproduce your code with R 3.0.1, beeswarm_0.1.6 and ggplot2_0.9.3.1. All I’ve got is a basic bee swarm plot. Any hint ?
Thanx !
Hello,
I updated the code to work with latest versions (R 3.0.2, plyr 1.8, ggplot2 0.9.3.1, beeswarm 0.1.5). It now requires to load specifically package plyr to get the function round_any to work, and scale_colour_manual(value… is now written scale_colour_manual(values…
Cheers!
Thanks!
Package to do this for ggplot: https://github.com/eclarke/ggbeeswarm
Cool! Hope it will make it to CRAN soon.